Data Analysis

Every product generates data — user behaviour, transaction records, performance metrics, system logs — but raw data alone changes nothing. What drives decisions is the ability to extract clear, reliable insight from that data and connect it directly to what you build next. At Nebulae, we design and develop custom data analysis solutions that transform the numbers your product already collects into dashboards, pipelines, and reporting tools your team can act on. Whether you're a founder trying to understand how users move through your application or a product lead who needs operational metrics surfaced in real time, we build the software that makes that analysis possible — not off-the-shelf, but fitted precisely to your data model and your decisions.

About Data Analysis

Data analysis involves examining and interpreting data to extract meaningful insights. In the digital realm, businesses analyze data to understand user behavior, track performance metrics, and inform decision-making. Techniques such as statistical analysis, machine learning, and data visualization are employed to uncover patterns, trends, and correlations within large datasets. Data analysis is a fundamental component of digital strategy, guiding organizations in refining their approaches based on empirical evidence.

Raw data collected. Meaning extracted.

What We Build

We design and build custom dashboards that give your team a clear, real-time view of the metrics that matter — without the noise of generic off-the-shelf tools that don't map to your actual data model. Each dashboard is purpose-built around the structure of your data and the decisions your team needs to make, whether that means tracking operational KPIs, monitoring product usage, or surfacing financial performance across business units. We work closely with clients to define the right views, drill-down paths, and refresh cadences so the end result is something people actually open and trust.

Alongside front-end visualisation, we build the data pipelines and reporting infrastructure that make reliable analysis possible. That includes ingestion layers that pull from multiple source systems, transformation logic that cleans and models raw data into consistent structures, and reporting tools that export or schedule outputs in the formats your stakeholders need. The result is an integrated data layer — not a collection of disconnected exports and manual spreadsheets — built specifically around how your organisation works and what it needs to measure.

Image

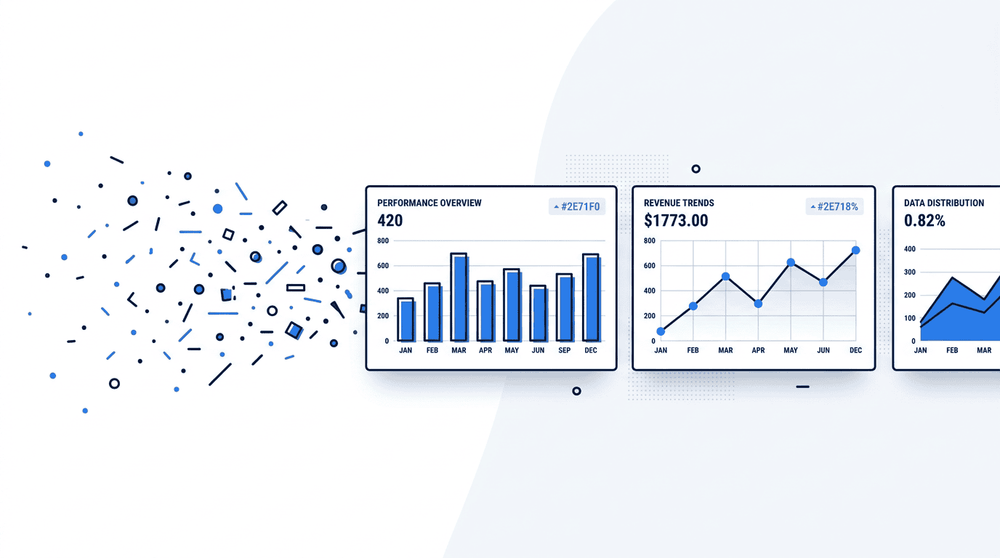
From Raw Data to Clear Dashboards

We take scattered data sources and wire them into a single, structured web dashboard where the numbers that matter are always visible. KPIs, trends, and anomalies surface as clean charts and tables — not buried in spreadsheets. Every visual element maps directly to a metric your team already tracks, so onboarding is fast and adoption sticks. The result is a dashboard your stakeholders actually open.

How We Work

Every engagement starts with a structured discovery phase where we sit down with your team to map out your existing data sources, understand the business questions you need answered, and define what a successful outcome looks like. We audit what data you already have — whether that's a relational database, a third-party API feed, a data warehouse, or raw files — and identify gaps that would prevent meaningful analysis. From there, we draft an architecture that fits your scale and your team's ability to maintain it going forward, not just what looks impressive on a diagram.

Once the architecture is agreed upon, we move into the build phase: setting up data pipelines, transformations, and the analytical layer — dashboards, reports, or APIs — that surfaces insights to the right people in the right format. We work iteratively, delivering usable outputs early so you can validate that the analysis is answering the right questions before we go deeper. At handover, we document the data model, the pipeline logic, and the decisions made along the way, so your team can extend and maintain the product without being dependent on us.
Image

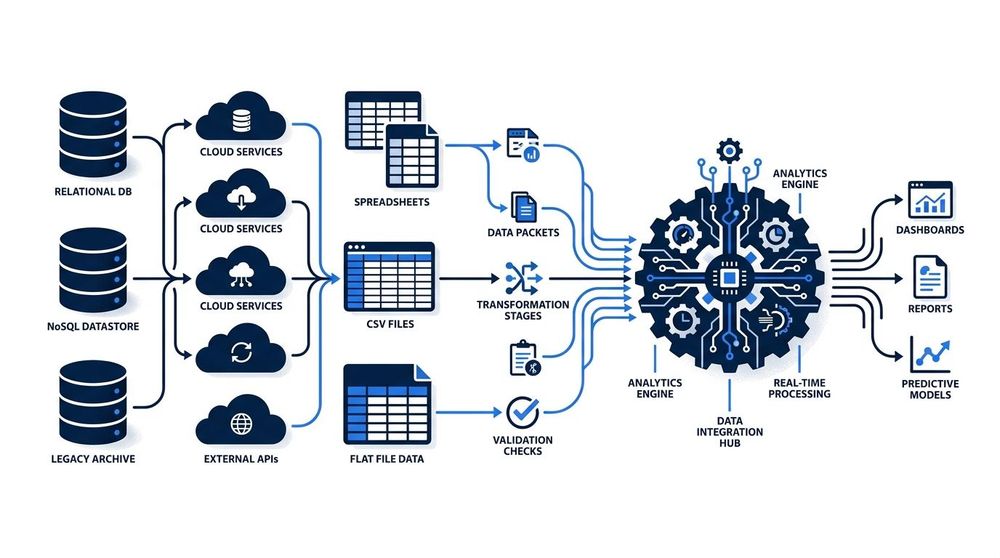
Connecting Your Data Sources

We integrate data analysis tooling directly into your existing product stack — whether that means querying relational databases, consuming third-party APIs, or ingesting event streams from your own services. Rather than treating analytics as a layer bolted on after the fact, we wire data pipelines in from the start. The result is a coherent flow from raw source to usable insight, with no manual exports or disconnected spreadsheets in between.

Off-the-shelf BI tools work well when your data is clean, your schema is stable, and your questions fit the templates someone else designed. Most teams with real, custom data requirements hit those ceilings quickly — and the answer isn't a more expensive SaaS license. It's a development partner who understands the full stack: from how data is ingested and modeled, to how it's queried and surfaced in a way that actually matches how your team makes decisions. That's the difference between a dashboard that looks good in a demo and one that gets used every day.

Frequently Asked Questions

Find answers to common questions about our services

Like what you see?

Get in touch and we will be happy to discuss your project.